How Data Visualization Technologies Helping Health Workers Keeping Things On Track
- By Abhishek Jain
- 03-06-2021
- Technology
The healthcare sector is under immense pressure these days, owing to a pandemic that continues to ravage the human population unabated worldwide. The doctors and clinical staff are working overtime, and they are trying their level best to contain its spread and save the infected victims. The healthcare setups rely on data analysis to figure out various aspects of the pandemic such as death count, infection rate per state and country, recovery rate, vaccination progress etc. For healthcare sector workers, quick and proper analysis of data, therefore, is vital.
Importance of data visualization in the healthcare sector
The healthcare sector workers, including the doctors and clinical staff, need to analyze massive amounts of data obtained from various sources, and after that, they have to reach a consensus. They go through printed reports, news articles, data obtained from medical apps, EHR data and clinical reports, govt. sources etc. Compiling and analyzing such data and generating reports based on the sources is something that can't be done manually. That is where data visualization applications come into the picture.
There are tailor-made data analysis and visualization applications that are being used by a lot of clinics and hospitals, as well as doctors. These apps are used to analyze medical data and draw conclusions based on the visual representation of the findings. A large number of clinical setups are relying upon power bi solution for such needs. Power BI comes with extensive data analysis features, and its data visualization options are very useful.
Clinical data visualizations not only help the doctors to understand various trends and health metrics of the patients, but these can also be useful for the patients. Patients can get real-time updates on various health metrics and pandemic trends by accessing the data visualization tools.
The basics of data visualization in the healthcare sector
By using data visualization tools and solutions, healthcare setups can generate a visual presentation of data that can be useful both for the doctors and the patients. These are also useful for other clinical staff. The major visual components found in these apps are:
• Charts- The top Data visualization tools come with chart generation features. These can be handy for the doctors and clinical staff who want to get updates on clinical trends. They can use charts of varying types to understand infection growth rate, time and region-wise. They can also deploy charts to understand death and recovery rate in various regions. Such charts can also be of use to people who have recovered and want to get updates on the infection rate of the region.
• Infographics- The Infographics let people with limited clinical concepts understand the nuances of health issues. These are easy to understand for people from various age groups and education levels. These contain both images and statistics.
• Reports- The clinical setups and doctors also need to interact with colleagues and similar entities from time to time. They need to share data a lot. In a hospital, different departments need to share updated data as well. The data visualization apps have robust report generation capabilities. These reports can be shared online easily after creation. These can be published through various online means.
• Dashboards- In clinical setups, the workers and doctors need to stay updated on nuances of patient health at all times. During a pandemic situation, this becomes even more important. The dashboards used in the data visualization apps like Power BI help the clinical workers stay updated on various aspects of patient health. The interactive dashboards update and show real-time data on infection rates, death count, recovery rate, etc. These are linked with multiple data sources, and updating of data is done in the background.
A data visualization tool may ship with other visual elements such as animation overlay, voiceover, video, graph etc. While Power BI ships with most of these features embedded, to make the best use of them, you may have to hire a veteran power bi designer or consultant.
Key Benefits of using data visualization applications in the healthcare sector
1. Real-time data update- By using Data visualization tools like Power BI, the operational hassles can be reduced to an extent. These tools are linked with numerous data sources, and real-time update of data is obtained automatically. So, the staff can focus on doing other work rather than updating data sources manually.
2. Fewer errors- When data visualization applications are used in healthcare setup, errors in the handling of data is minimized. There is no need for manual data entry and updating as such. Once the tool is configured properly, data syncing and updating is automated and error-free. As it is, data handling errors can lead to serious issues in clinical setups.
3. Lower contamination risk- In a pandemic situation, using a data visualization tool helps the clinics and hospitals minimize the risk of contamination. They deal with Covid-19 patients a lot, and it is necessary for the staff to stay safe. When these tools are used, less manpower is required for data management and analysis. Visuals and reports can be shared remotely. So, the risk of contracting an infection at the workplace is reduced to an extent.
4. Reduced delay- Usage of data visualization applications in healthcare organizations, help reduce operational delays. It becomes possible to keep track of patient's health metrics 24x7. The staff and doctors receive updates anytime, and they can make key decisions without delay. In a pandemic situation, the right decision and prompt action by the medical staff and physicians can save the lives of millions.
5. Better resource utilization- When data visualization tools are used in hospitals or clinics, the staff is able to manage the resources better. The management stays updated on materials and resources that are depleting fast and need fresh stocking. This can be handy in a pandemic when the healthcare setups are reeling under a shortage of medical supplies in many places.
6. Better patient handling- In many healthcare setups, there are patients coping with critical health conditions. It is not possible for the doctors and staff to attend to all such patients with rapt attention, 24x7. However, modern data visualization tools can be synced with medical surveillance devices and sensors to keep track of vital metrics of such patients. Any change in health metrics like heart rate, pulse and BP fluctuation gets reported to the doctors, and they can intervene fast. This can be the savior for such patients.
7. Better remote monitoring and telemedicine- In the present scenario, many Covid-19 patients have advised self-isolation for recovery. However, their health condition may deteriorate unexpectedly, or some health complications can crop up. So, these patients can be put under remote monitoring systems, and such systems can be synced with data analysis and visualization solutions. Any change in their health metrics can alert the doctors, and they can offer telemedicine services or remedial measures remotely.
8. Helpful for tracking vaccination coverage- While vaccination for Covid-19 is being rolled out worldwide, the reality is that a majority of the global population is yet to be covered. The medical staff dealing with vaccination work can gain from using data visualization tools. They can stay updated on aspects like areas that are lagging in vaccination or percentage of population vaccinated in the region overtime etc.
Wrapping up
There are quite a few data visualization tools that can be useful for the healthcare sector. However, a number of top healthcare organizations have opted for Power bi implementation, and the results are pretty encouraging. The solution is useful for many clinical setups, and it comes in many forms, and that makes it suited for hospitals or clinics of varying types and sizes. The large-scale healthcare organizations, however, can opt for the power bi consulting services.
Author

Abhishek Jain
Abhishek Jain is the head of marketing at Imenso Software, which is a renowned software development company in India & it offers high-quality IT services that evolve with corresponding business trends and technology.
Recent blog
.jpg)
5 Best Inventory Replenishment Software for Manufacturers in 2026
Software | 23-07-2026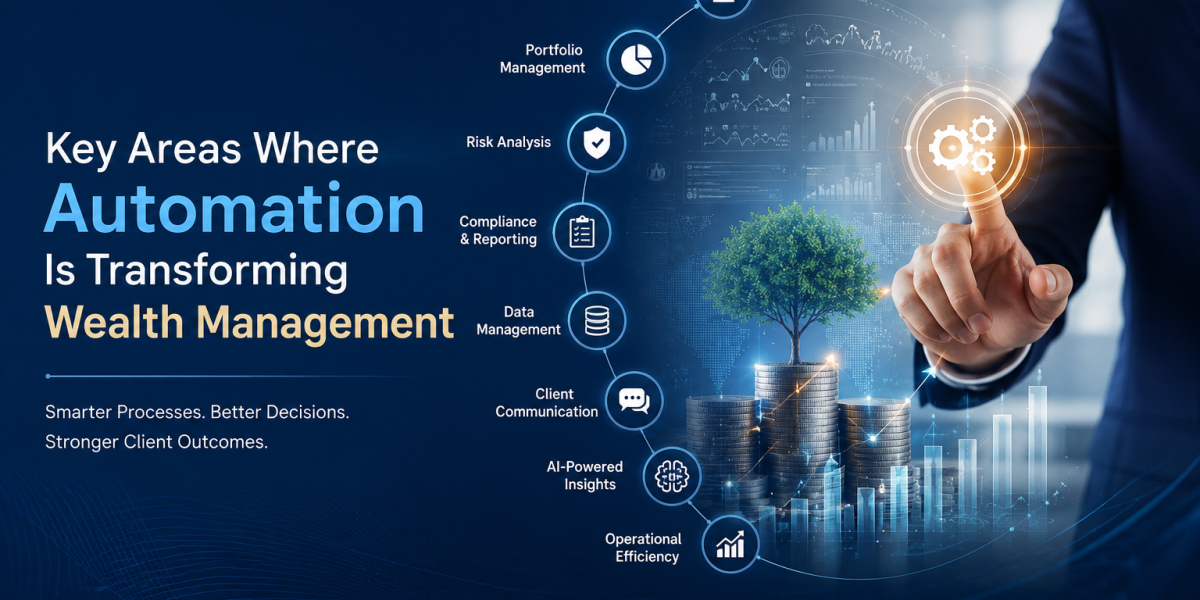
Wealth Management Automation: 10 Key Areas Driving Growth
Artificial Intelligence | 21-07-2026.jpg)
Why Efficient Data Handling Drives Digital Growth
Big Data | 20-07-2026